Weekly Update | November 10, 2023
Let’s hop straight into five of the biggest developments this week.
1. UK construction PMI marginally ticked up to 45.6
The UK construction sector remained in contraction for the second consecutive month in October according to the monthly PMI survey. The report indicated slower than expected activity, which fell short of the 46.1 expected by markets, despite a marginal uptick from the previous 45.0. High borrowing costs and overall low consumer confidence are notable contributors to fragile demand that stifled sector growth.
2. RBA hiked interest rates 0.25%
The RBA hiked interest rates by a further 25 basis points, after holding for the 4 months prior. This brought the cash rate to 4.35%. With price elevation on the rise, at a time when Australia trails other major economies on interest rates, the central bank was compelled to act now rather than later. As inflation is still around 6%, it is still well above their target rate. The statement discussed a softening stance for future meetings.
3. New Zealand inflation expectations q/q eased 2.76%
The quarterly survey report indicated a fall in two-year-ahead inflation expectancy to 2.76% from the previous 2.83%. The inference is that markets are upbeat that the central bank’s aggressive monetary policy tightening will have the desired effect of achieving its 2-3% inflation target in two years.
4. Chinese CPI y/y slumped -0.2% in October
Annual inflation in China plunged into effective disinflation, as data in the twelve months to October reported at -0.2%. While deflation was expected from the previous stagflation figure of 0.0%, the rate of inflationary contraction was higher than the -0.1% expected by market participants. This makes for a perfect storm for the PBOC as it struggles to boost economic activity and maintain the value of the Yuan simultaneously.
5. US unemployment claims ticked lower to 217k
US unemployment claims remained relatively resilient at 217k last week. The figure was a marginal reduction from the previous upwardly revised figure of 220k, and just short of market expectations of 218k. Markets consider the current US unemployment market still robust, however any continued rise may provide concerns that the labour market is slowing at a greater rate than intended.
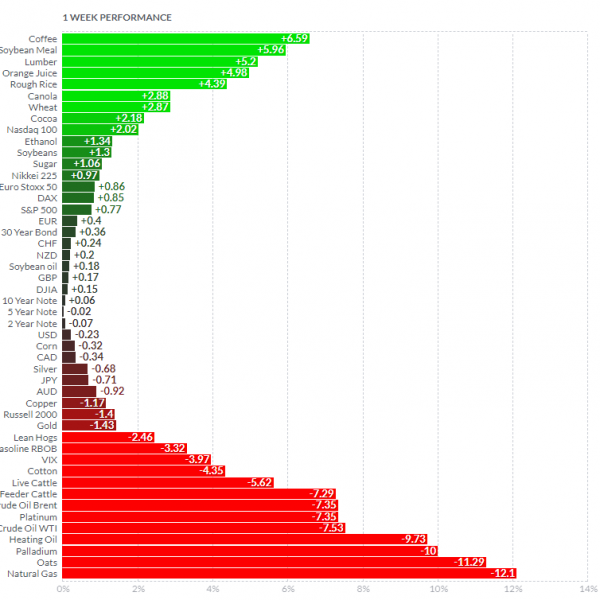
Below shows the performance of a range of futures markets we track. Some of these are included within the universe of our multi-strategy hedge fund.

The major volatility over the course of the week has been in the crude and natural gas market. Warmer weather conditions in Europe and North America have driven prices lower, while supply imbalances continue to plague the market. We continue to see weak data from China, which continues to drag crude and risk on currencies like Copper. Palladium and Platinum continued to fall, with Palladium falling through the key $1000 mark overnight.
The trend in Lean hogs seems to be over as it hit a 6-month low. US cattle prices have been extremely buoyant despite increases in global supply. This excess supply has dragged on Australian cattle prices for the last 2 years.
In equity markets, the Russell continues to suffer, stringing 4 consecutive down days, while the Nasdaq has remained relatively buoyant. There has been nothing significant to note in the soft and grains markets.
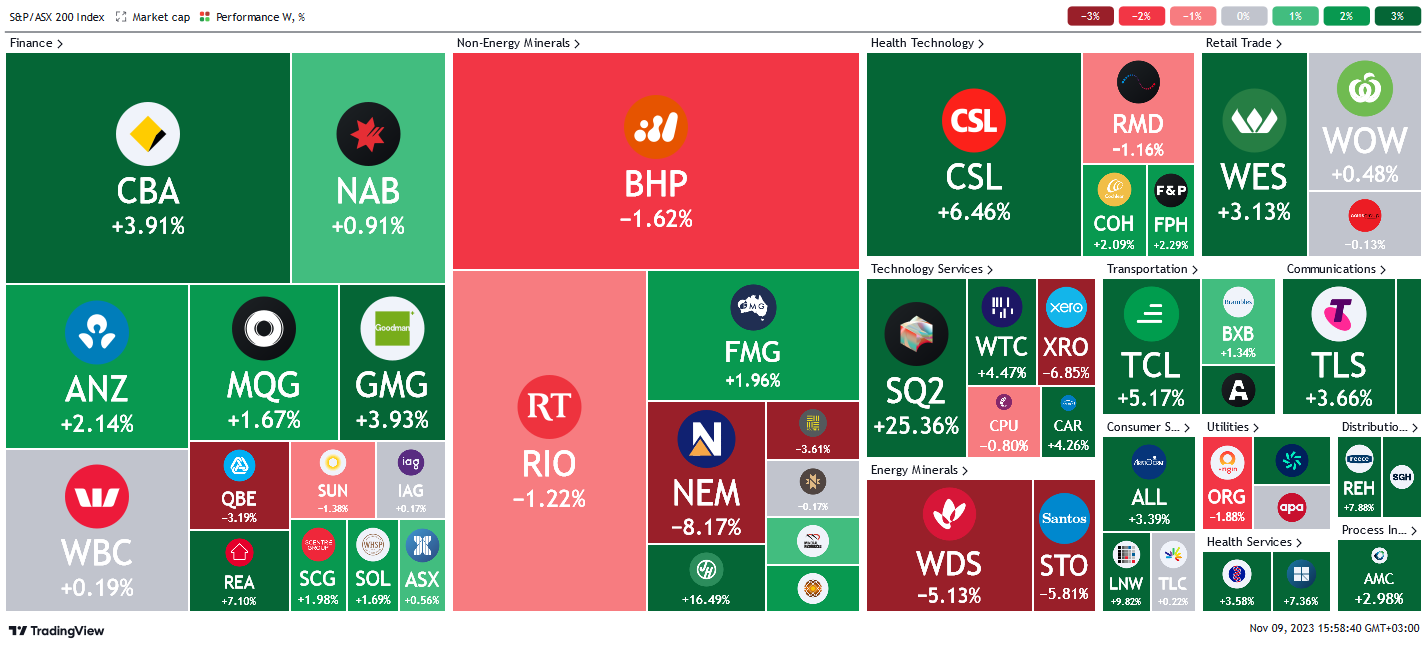
Here is the week’s heatmap for the largest companies in the ASX.
 A mixed but inherently positive week for the ASX with most sectors holding on and extending upward momentum from last week. The financial sector posted a solid performance with most stocks in the green. REA outperformed the index with a massive +7% gain while CBA and GMG both posted gains of over +3%. QBE and SUN were the rare weak spots for the sector, closing down for the week. In the energy sector, WDS and STO continued to suffer as the price of crude & gas slid. Non-energy materials were mixed with FMG as the only bright spot. Healthcare had its first positive week in a very long time, as CSL rebounded 6.46%. SQ2 (Afterpay) had a very solid week up 25.36% after they announced their quarterly results.
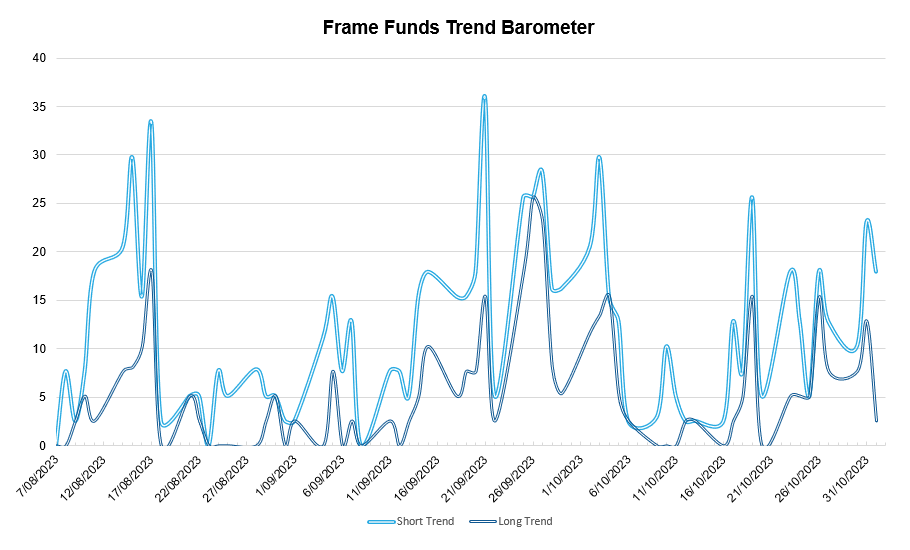
Below shows our proprietary trend following barometer which captures the number of futures contracts within our universe hitting new short and long-term trends.

*Historically there is a positive correlation between the number of constituents experiencing both short and long-term trends and the performance of the strategy.
Please reach out if you’d like to find out more about how our quantitative approach captures the price action covered above, or if you would like to receive these updates directly to your inbox, please email admin@framefunds.com.au.